
The Database
The Significant Oil and Gas Fields of the United States Database has not only set the standard for oil and gas field, reservoir, and play databases during the past thirty years;
It has revolutionized that standard!
Our leadership in providing strategic information for upstream decisions is the result of a unique database design philosophy. We collect, develop, and organize data specifically to meet the strategic information needs of the upstream oil and gas industry. Our corporate history is one of continuous innovation to enhance the ability of the Database to meet these changing needs.
DESIGNED TO ANSWER THESE KEY STRATEGIC QUESTIONS
Where oil and gas recovery is growing by play, play type, reservoir, and field and how this growth correlates with drilling activity and production
How productivity by well is distributed spatially in tight oil and shale gas plays
How the composition of production by play is changing over time in geologic provinces and both among and within play types
Which older reservoirs may have redevelopment opportunities using new technologies
What is the changing composition over time of drilling activity by play within provinces as prices change
How does the spatial pattern of drilling activity change within a play as its spatial distribution of well productivity becomes better known
What are the implications of well density and the spatial distribution of well productivity for unconventional play resource potential
THE UNIQUE COMBINATION OF FEATURES OF THE DATABASE GIVE IT THE CAPABILITY TO ADDRESS A BROAD RANGE OF STRATEGIC ISSUES
Complete integration of information by field, reservoir, and play
Comprehensive linking of producible well data to fields, reservoirs, and plays
Thoughtful organization (both geologic and geographic) of the data to facilitate a broad variety of data groupings
Accurate economic field, reservoir, and play production and size histories
Broad range of relevant information with high rates of coverage by variable
Conceptually uniform variable definitions
Thorough data quality control
Wide-ranging retrieval capabilities that can be spatially displayed
SCOPE
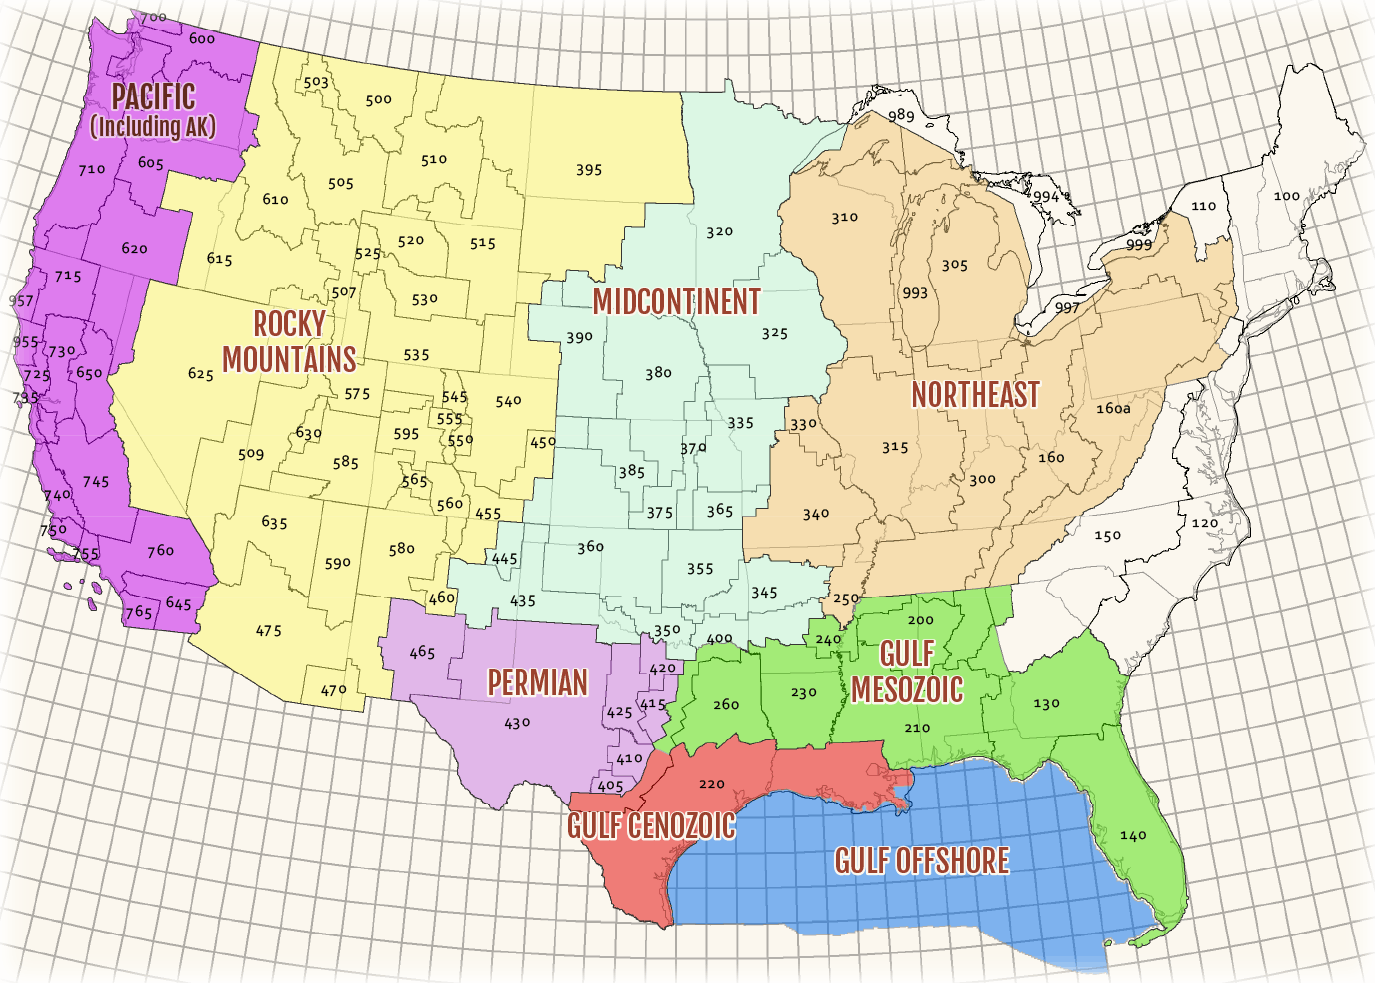
The Significant Oil and Gas Fields of the United States Database covers all producing provinces (basins) in the U.S. excluding only the Cincinnati Arch and the older fields of the Appalachian Basin (we include the Marcellus, Utica, and Geneseo plays). To facilitate data research, testing, and use, the database is divided into eight geographic regions: Gulf Coast Cenozoic, Gulf Coast Mesozoic, Gulf of Mexico, Midcontinent, Northeast, Pacific (including Alaska), Permian, and Rocky Mountain. (See map below).
The database includes all types of oil and gas production: Conventional, Unconventional, and Transitional. We add new unconventional plays as soon as they have demonstrated commercial levels of production.
DATABASE REGIONS MAP
DATABASE COMPONENTS
FIELD INFORMATION
The Database provides information on more than 17000 significant fields that can be used to create size distributions, production histories, growth histories, and discovery histories.
 Learn more about FIELD INFORMATION
RESERVOIR INFORMATION
The Database provides information on more than 27,000 major reservoirs that can be used to create size distributions, production histories, rock and fluid property distributions, recovery growth histories, and discovery histories.
PLAY INFORMATION
The reservoirs of the Database are organized into 700 productive oil and gas plays. The Play Characteristics Table provides aggregate information about play size, growth, and recent production
WELL CROSS-REFERENCE
The Well Cross-Reference Table of the Database links more than two million producible completions to the fields, reservoirs, and plays of the database. It can be used to analyze drilling activity and to create distributions of well productivity by play.
SPATIAL DISPLAY
All the information in the Database can be displayed spatially using its field, reservoir, and play outlines and well locations.
Updating, Upgrading, and Testing
Both the field and reservoir data in the database are updated annually. With each update, another year of production data for crude oil, natural gas, and natural gas liquids and another year of well data are added. All estimates of known (ultimate) recovery and proved reserves are reviewed, updated, and revised as necessary. (Production and reserve data for small fields - those between 0.5 and 1.0 million BOE- are only updated every even year.) Data on new significant fields and new major reservoirs are also added. New plays are added whenever they qualify for inclusion.
Many field and reservoir variables are reviewed periodically and revised as necessary. When new data sources become available, we improve our data coverage. Periodically new variables are added to the database. New features are also added, such as the Play Characteristics Table in 2010 and the Well Cross-Reference Table and the Field and Reservoir Outlines in 2014-2015. Fundamental features of the database, such as the formation code system in 2002-2005, occasionally undergo systematic review and improvement.
The current version of the database incorporates more than 200 person-years of intensive research. This research was conducted according to the rigorous standards for the database developed by Nehring Associates in discussion with the initial licensees of the database. Our thorough research and testing have been designed to enable our licensees to use the database with confidence.