Play Information
Oil and gas plays - the third level of data included in the Database - serve a dual role
- They provide the primary means of organizing reservoir information into meaningful groups for analysis
- The Play Characteristics Table provides aggregate information by play, thereby supplying a means for understanding the composition of national and regional trends by key plays
Plays in the Database are defined as groups of reservoirs and prospects in the same geographic area sharing similar geologic characteristics. They correspond to exploration and development concepts.
Each play is identified by a name that incorporates the general play location, its primary producing formation, and its hydrocarbon type. A complete list of the nearly 700 database plays is provided in the NRGPLAYS table of the Database. The uses of the reservoir information listed in Reservoir Information are primarily retrievals by play or groups of plays.
ALL PLAYS ARE CLASSIFIED BY THESE GENERAL AND SPECIFIC TYPES
- Conventional
-
Unconventional
- Coalbed Methane
- Shale Gas
- Tight Sandstone/Carbonate
- Tight Oil
-
Transitional
- Arctic
- Deep
- Deepwater
- Heavy Oil
- Ultra Deep
Transitional plays are usually plays with good reservoir properties in more expensive environments
FACILITATING AGGREGATE PLAY ANALYSIS: THE PLAY CHARACTERISTICS TABLE
Play analysis is the foundation of both conventional and unconventional upstream evaluation. Despite its centrality over the past several decades, play analysis has been hampered by a lack of means for understanding plays in their totality, for comparing plays, and for summing plays by meaningful aggregates, such as specific play types.
The Play Characteristics Table of the Database is designed to extend the capabilities of play evaluation, providing summary information on all 700 plays in the Database. This information is divided among six groups:
Play Identification and Location
Basic Play Geology
Current Known Play Size – Cumulative production, proved developed reserves, and known recovery of crude oil, natural gas, NGLs, and in BOE,
Recent Play Growth – For crude oil, natural gas, NGLs, and in BOE
Recent (2000-current) Play Production – For crude oil, natural gas, and NGLs
Summary Play Discovery History
Aggregate information in the Play Characteristics Table has been created by summing reservoir size, production, and growth from the reservoir data in the Reservoir Master (RMASTER) table of the database. Distributions of these variables among the reservoirs constituting each play can be obtained using the reservoir retrievals of the KnowNow retrieval system. Distributions of rock and fluid characteristics (none of which are suitable for aggregation) and a variety of time series by play can also be obtained using KnowNow.
The Play Characteristics Table is provided in Access, Excel, and Geodatabase tables. A complete set of digital play outlines is included with each delivery.
Using the Play Characteristics Table
The Play Characteristics Table serves four primary uses:
Examining the composition of recent national, regional, and basin production and growth by specific play type and key individual plays
Providing a play screening tool, sorting by values such as play size, growth, and production both within and among specific play types
Conducting play comparisons within any specified play grouping such as specific play type or geologic province
Creating a foundation for developing relevant play analogs
In addition to tabular and graphical displays, the data from the Play Characteristics Table can also be displayed spatially, using the digital play outlines that accompany the table.
illustrations of the growth and composition of unconventional production
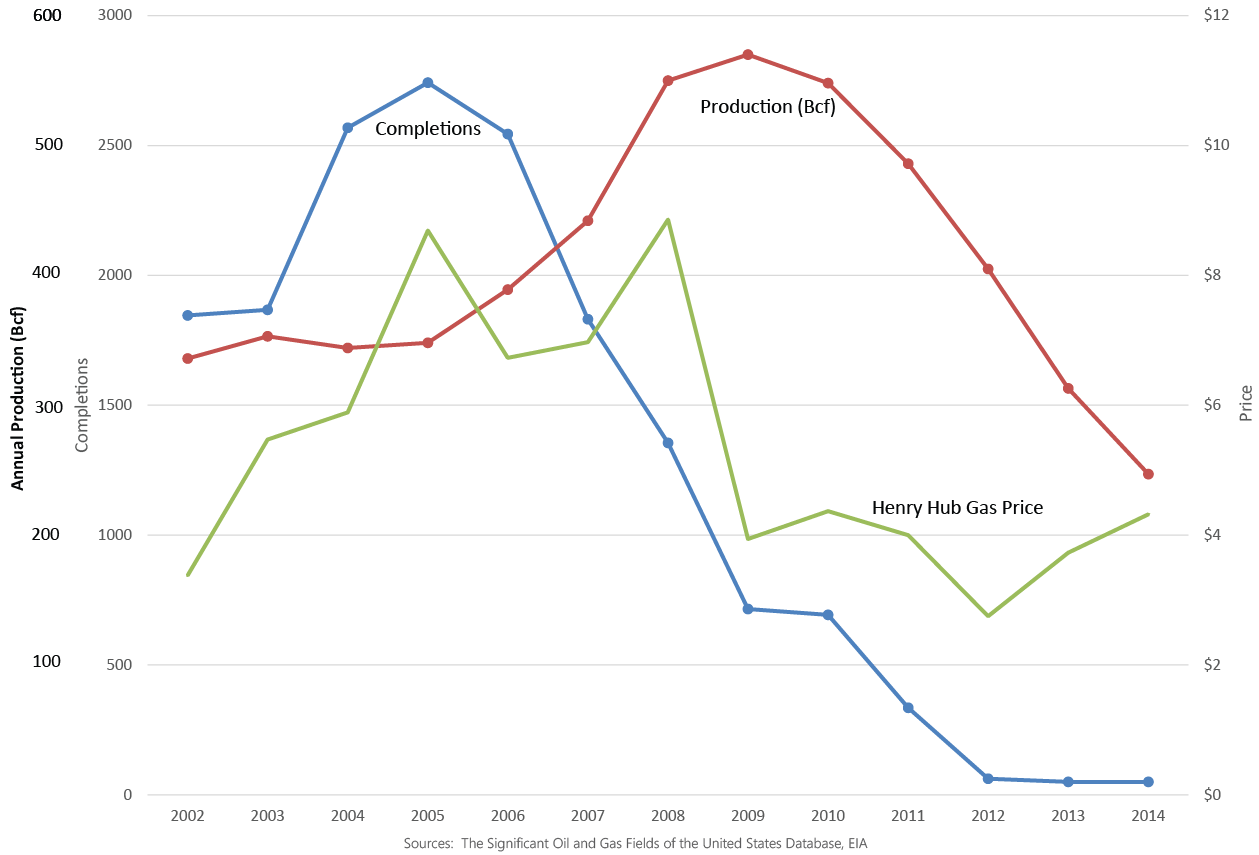
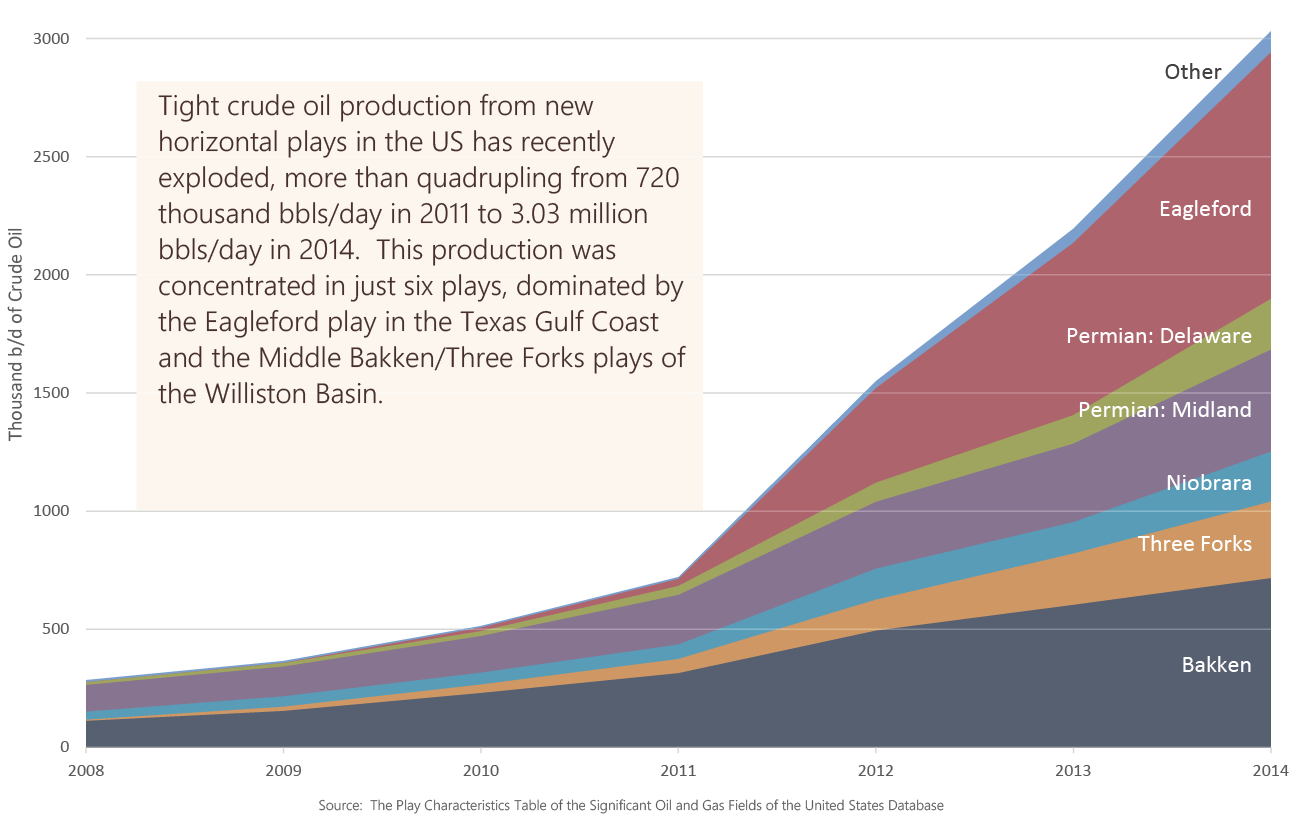
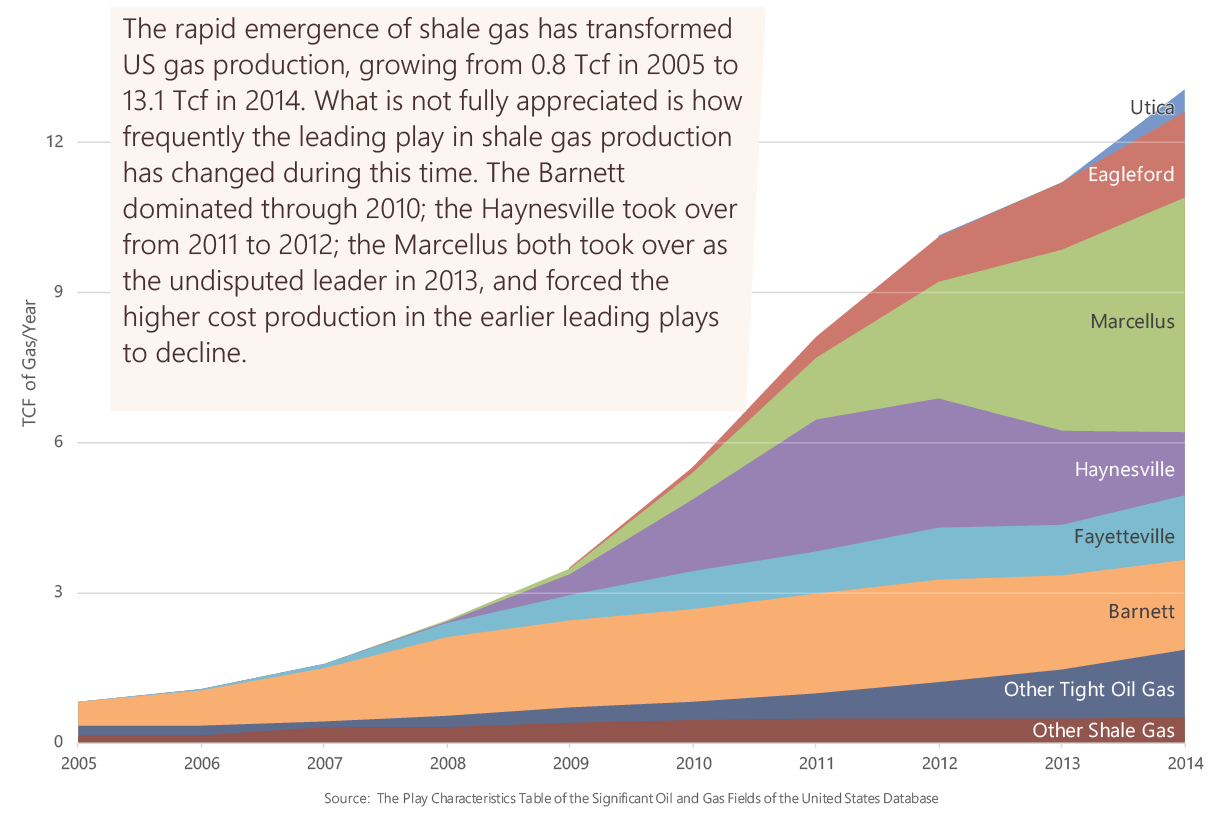
The first shows growth by play in new tight oil production from 2008-2014. The second shows the growth and changing composition of shale gas/tight oil dry gas production from 2005-2014 by its key individual plays. The third correlates Powder River Basin CBM production with both annual completions in this play and the Henry Hub average annual gas price.
The Concentration of Exploding New Tight Oil Production By Play, 2008-2014
THE RAPID EMERGENCE AND CHANGING COMPOSITION OF SHALE GAS PRODUCTION, 2005-2014
The Rise and Fall of Powder River Basin CBM Production, 2002-2014