
THE WELL CROSS-REFERENCE TABLE
Well analysis has been the staple of upstream analysis for decades. Despite its centrality, well analysis has been handicapped by the lack of organization of well data, limiting the capability to group wells into meaningful categories.
The Well Cross-Reference Table of the Database extends the capabilities of well analysis by linking more than two million producible completions in the U.S. to the fields, reservoirs, and plays of the Database.
It does so by linking the API well code of every well to the entity identifiers (keys) of the three major components of the Database:
- Fields – NRGID (our unique field code) and field name
- Reservoirs – NRGID, field name, reservoir age rank, and producing formation code
- Plays – NRGPLAY (our unique play code)
The table also provides information on well location (SL and BHL in latitude/longitude), well completion date, well type (V, D, or H), well hydrocarbon type, state field and reservoir names, and well lateral length.
Using the Well Cross-Reference Table
The Well Cross-Reference Table has two primary uses:
-
By itself, it can be used to analyze drilling activity by play. This includes both:
- temporal comparisons of drilling activity among plays
- spatial-temporal patterns of drilling within any individual play
-
When linked to monthly production data by well, the table can be used to facilitate developing distributions of per well productivity by play. This includes:
- grouping those distributions into spatially defined subplays
- differentiating subplay distributions by vintage (to ascertain possible improvements in completion technology)
- correlating differences in productivity with their geologic controls.
ILLUSTRATIONS OF WELL CROSS-REFERENCE CAPABILITIES
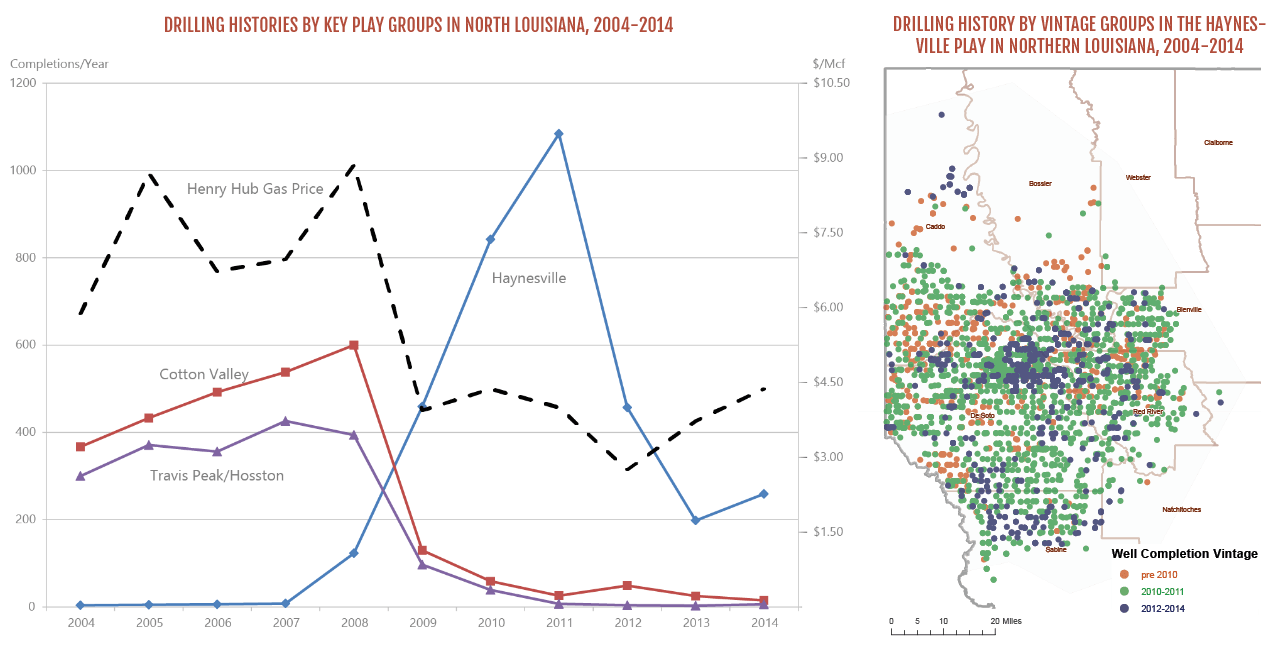
The first illustration of this pair shows the number of completions annually in north Louisiana from 2004 to 2014 for two groups of tight sandstone plays (Cotton Valley and Hosston/Travis Peak) and the shale gas Haynesville play. The second illustration shows the spatial distribution of Haynesville completions in North Lousiana for three different vintage periods; pre-2010, 2010-2011, and 2012-2014.
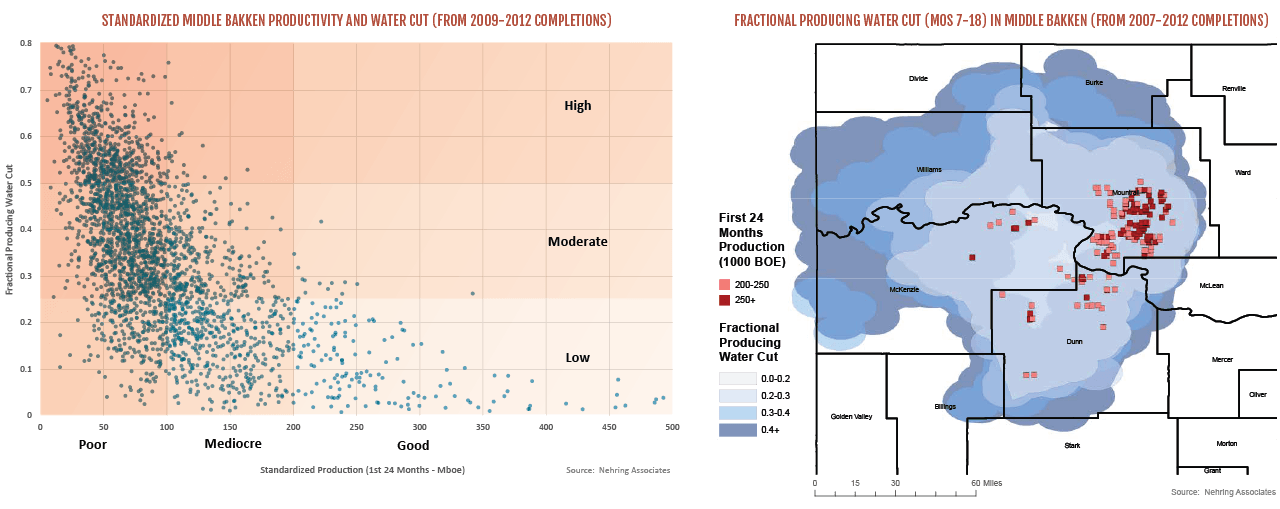
The first illustration of this second pair correlates standardized (per 5000 foot lateral) production for Middle Bakken tight oil wells in North Dakota with the fractional producing water cut in these same wells. The second shows the spatial distribution of the approximate water cut in the Middle Bakken together with the location of all good productivity Middle Bakken wells.
Nehring Associates also uses an expanded version of the Well Cross-Reference Table to create the Field and Reservoir Outlines of the database. Learn more about Spatial Display